|
High order harmonic generation and attosecond pulse characterization
Multicolor radiography of plasma plumes using high-harmonic source:
The high order harmonic source is used for multicolor radiography, to probe the density of atomic and molecular species present in the plasma plumes simultaneously. The plasma plume was formed by focusing a 200ps laser pulse on solid carbon (graphite) target. The high-harmonics from 11th (~15eV) to 21st (~30eV) order of the Ti: sapphire laser pulse is used as a back lighter source. From the recorded radiograph of plasma plume for different harmonic order, the density profile of CI, CII and C2 is estimated using Beer Lambert’s Law. All the three species shows the peak density of ~ 8×1018 cm-3, ~ 4×1018 cm-3 and ~ 3.5×1017 cm-3 at ~ 150μm, ~170μm and ~120μm distance away from target surface respectively at a delay of 50 ns after plasma formation as shown in Fig 1. The expansion speed of the carbon plume formed by 200ps laser pulse at ~1011 W/cm2 intensity is calculated to be ~ 106 cm/s.
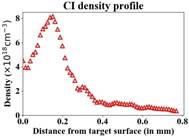 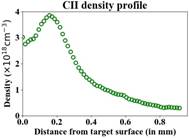 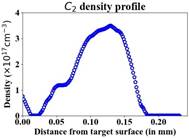
Fig. 1: The density profile of (a) neutral carbon atom, (b) singly charged carbon ion and (c) carbon dimer molecule (C2) respectively.
High-harmonic generation in gas cell:
The generation of high-harmonic is carried out in gas cell filled with inert gas. The study is performed in argon, neon and helium gas filled cells of different length of the cell. An experimental setup used for HHG from gas filled cells, is shown in Fig 2.

Fig. 2: The experimental setup used for generation of high-harmonic from gas cell. In Fig 2, FFGS: Flat field grating Spectrograph, VLSG: Variable line spaced grating, MCP: Micro-channel plate, CCD: Charge coupled device
The generated high-harmonics are dispersed and detected using FFGS. High-harmonic radiation with cut-off order of (a) 37th is observed in argon, 77th in neon and (b) ~ 103rd order in helium gas (b).
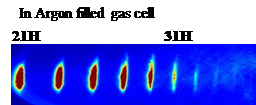 
Fig. 3: A typical high-harmonic spectrum recorded in (a) Argon filled cell with cutoff 37th order and (b) Helium filled cell with cutoff 103rd order.
Study of electron trajectory resolved high-harmonic generation and its spatial coherence:
According to three step model, the high harmonics are generated after recombination of the tunneled electron to atom, after its acceleration in intense laser field. Simple calculation using classical mechanics say that there are several electron trajectories possible; however they can be broadly classified into two categories viz. long trajectory and short trajectory. The high-harmonic generation from these two trajectories leaves their imprint in the generated harmonics. Due to combined effect of these two trajectories, the harmonic spectrum shows broadening, splitting. Also, difference in temporal coherence of high-harmonics has already been reported by other groups and available in literatures. In our studies, we showed that spatial coherence of the harmonic generated by these two trajectories is different. For this, we compared the high harmonics generated in argon gas using (a) single color (λ~800nm) and (b) two color (λ~800nm+400nm) Ti:Saphiire laser pulse for high-harmonic generation as shown in Fig 4.
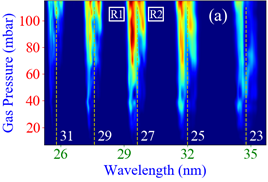 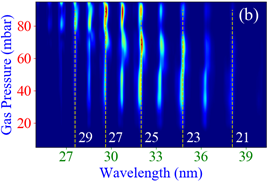
Fig. 4: The variation of harmonic spectrum for 23rd to 31st order with gas pressure in case of (a) single color laser pulse(λ~800nm ) and (b) two color laser pulses (λ~800nm + 400nm)
The difference in harmonic spectrum for single and two color laser pulses can be clearly seen in Fig 4(a)-(b). The particular electron trajectory is identified from the shift and splitting in harmonic spectrum as well as comparing spectrum generated using single color (ω only) and two color laser pulses (ω+2ω both). The spatial coherence of trajectory resolved harmonics is performed using a fine double slit (~30µm width and 100µm separation).
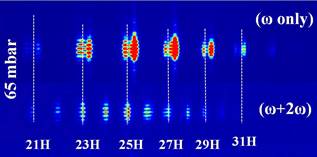 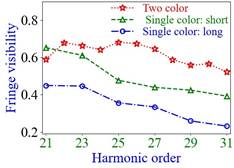
Fig. 5: (a) double slit interference fringe for 21st to 31st harmonic order for single and two color laser pulses generated harmonics and (b) the line profile of interference fringe for single color long and short trajectory generated harmonics and two color generated HHG.
In case of single color laser pulse generated harmonics, the spatial coherence of harmonics generated from short trajectory is higher than that generated using long trajectory as shown in Fig 5. For two color laser generated harmonics, the fringe visibility is higher than single color case (see Fig 5b). The theoretical analysis is also performed to understand the observed result and found to be consistent with the experimental observations.
Temporal Characterization of high-harmonic radiation:
The frequency comb of odd harmonic orders in high-harmonic spectrum gives rise to a train of attosecond pulses separated by half laser cycle in time domain, provided these odd orders are phase locked. Due to coherent generation process, an inherent phase locking is already present between the odd harmonic orders, thus a train of attosecond pulses are generated.
Theoretically it is easy to understand the generation of attosecond pulses from high-harmonic radiation however it is extremely challenging to measure them experimentally. The major reason being the absence of non-linear medium to use autocorrelation technique, which is conventionally used to measure the temporal width of femtosecond infra-red laser pulse. Secondly, being a short wavelength source (wavelength may go from extreme-ultraviolet (XUV) to soft x-ray regime), the normal incidence mirror for such large bandwidth, to cover complete harmonic spectrum is not available.
A new technique is developed for characterization of such broadband high-harmonic pulses. These pulses are focused in a low pressure gas sheath to generate photoelectron using single photon absorption. The generated photoelectron pulse is expected to be a replica of attosecond high-harmonic pulses. The photoelectron spectrum has peaks correspond to odd harmonic orders. For temporal measurement an infra-red (IR) laser beam (a part of same Ti:sapphire laser pulse used for high-harmonic generation), is simultaneously focused in low pressure gas sheath and delay between the two beam is varied in small step. Due to presence of IR beam alongwith high-harmonic beam, sideband photoelectron peak appears between odd orders. Their position usually matches with that of even harmonic orders and are known as sideband peaks. These sideband peaks appear due to absorption / emission of one IR photon together with high-harmonic photons. For example, the sideband peaks at position of (q+1) th even harmonic order position arises due to absorption of one IR photon along with qth odd harmonic order or emission of one IR photon with (q+2)nd odd harmonic orders. Interference of these two pathways for generation of each sideband leads to oscillation of total photoelectron counts at interval of half laser cycle (~1.33fs for Ti:sapphire laser pulse). From this oscillation, the relative phase between the harmonic orders can be measured and a train of attosecond pulses can be reconstructed. This cross-correlation technique is used to estimate the average duration of individual pulse in pulse train and is known as “Reconstruction of Attosecond Beating of Two-Photon Transition (RABITT) “.
For experimental measurement of the photoelectron generated by interaction of high-harmonic pulses, an electron spectrograph is required. As the photon flux of the high-harmonic radiation is modest (~ 1012 Photons/sec for 23rd harmonic order in argon), the photoionization cross section is also low (few megabarn) and the spectral separation between the odd orders is 1.55eV, one needs an electron spectrograph with high resolution as well as high collection efficiency. A magnetic bottle electron spectrograph is now universally used for characterization of such ultrashort duration photoelectron pulse. We have also in-house designed and developed the magnetic bottle electron time of flight spectrograph for characterization of attosecond pulses.
Magnetic bottle electron time of flight (MB e-TOF) spectrograph:
In the electron time of fight spectrograph, the electrons with different time of flight are detected using a time resolved detector. The electrons with different energy, (velocity) generated at same time are passed through the drift region. These electrons take different time to travel same distance, hence gets dispersed in time. Thus, from the measurement of the arrival time at the detector, one can infer about the electron energy. In MB e-TOF spectrograph, magnetic bottle configuration is used, which ensures high collection efficiency (upto 2π radian). The MB e-TOF spectrograph consists of a permanent magnet and a long length solenoid at an optimum separation as shown in Fig 6. The permanent magnet is used to generate strong magnetic field, which collimates the photoelectrons generated from interaction region. The solenoid magnetic field is used for guiding of the photoelectrons towards the MCP detector. To increase the magnetic field further in the interaction region, a soft iron cone is placed over permanent magnet, to focus the magnetic field lines from its surface. The spectrograph uses a strong permanent magnet (samarium cobalt, Sm2Co14) with a soft iron cone to focus the magnetic field lines, which increases the magnetic field strength (~ 5kG) in the interaction region placed at ~2mm, away from the cone tip.
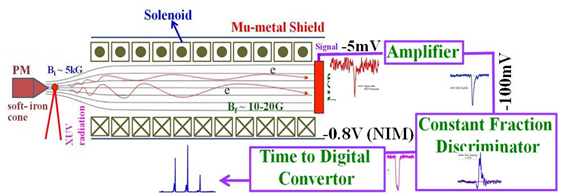
Fig. 6: A schematic of magnetic bottle electron time of flight (MB e-TOF) spectrograph.
In the interaction region, the photoelectrons are generated by XUV harmonics radiation. The generated photoelectrons follow strong magnetic field (Bi ≈5kG) of the permanent magnet and reaches inside solenoid. A small magnetic field inside the solenoid (Bf ≈10G), guide these photoelectrons to MCP detector. As the photoelectrons are guided in small magnetic field, the spectrograph should be shielded from the earth’s magnetic field as well. A 1mm thick μ-metal sheet is used to shield the spectrograph from any nearby stray field as well as earth’s magnetic field. After guiding through the solenoid, the electron reaches the MCP detector, where it generates a timing signal. This signal is processed by a data acquisition system (DAS), which consists of three electronic components, (a) low noise RF amplifier, (b) constant fraction discriminator (CFD) and (c) time to digital convertor (TDC).
Temporal characterization of high-harmonic generated attosecond pulses:
A Ti:sapphire laser pulse of 45 fs duration, central wavelength lo = 800nm, operating at 1 kHz repetition rate is used for the experiment as shown in Fig 7. A schematic diagram of the experimental setup is shown below. The laser pulse is divided into two parts using a beam splitter (BS). The energy of transmitted laser beam is measured to be 4mJ, whereas for reflected beam it is 1mJ. A delay line is placed between the two beams. The minimum temporal delay step between the two beams is ~70 attosecond using piezoelectric stages (10nm resolution). The transmitted laser beam is focused in a 15mm long argon filled cell to generate high-harmonics. These generated high-harmonics are focused using a grazing incidence toroidal mirror (Rs≈25mm and Rt≈10m) in a low pressure gas sheath (~10-5mbar) and photoelectrons are generated from the sheath through photoelectric effect. The photoelectrons are detected by MB e-TOF spectrograph. For the cross-correlation RABITT measurement, the reflected laser beam from the beam splitter (BS) is passed through a holed mirror, named as dressing laser beam. The dressing beam moves collinear to the higher harmonic generating laser beam, passes through gas cell and is refocused using toroidal mirror in the gas sheath. The energy of this beam is varied by a combination of polarizer and half wave plate, placed just before the holed mirror.
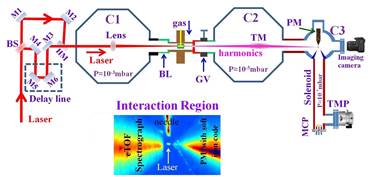 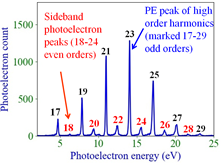
Fig. 7: (a) An experimental setup used for cross-correlation measurement of high-harmonic and IR dressing laser beam, which is used for attosecond pulse train characterization, (b) the photoelectron spectrum showing the photoelectron peak due to high-harmonics (blue) as well as generated side-bands (red). M1-M6: low GVD dielectric mirrors, C1-C3: Vacuum Chambers BS: Beam splitter, HM: Holed mirror, TM: Toroidal mirror, PM: Permanent Magnet, GV: Gate Valve, BL: Bellow
For the cross-correlation measurement, complete spatial and temporal overlapping of high-harmonics and dressing laser beam is essential. This is challenging task, as both laser beams are of ultrashort durations (femtosecond) and also the high-harmonic spectrum extends to XUV regime. The spatial overlapping can be achieved by placing a digital camera with an imaging lens in laser beam path to image the focal region. For temporal matching, a fast photodiode with rise time~20ps is placed in the overlapping region and temporal matching within ~200ps is achieved by observing the pulses with 4GHz bandwidth oscilloscope. Further, temporal matching is ensured by observing a autocorrelation signal between the two pulses using second harmonic autocorrelator setup.
After spatio-temporal overlap, the high-harmonics beam is focused in neon gas sheath and photoelectron spectrum is recorded. The Photoelectron peak corresponds to odd harmonics orders from 17th to 29th order was observed as shown in photoelectron spectrum. When both high-harmonic and dressing IR laser beam is simultaneously focused in gas sheath, additional photoelectron peaks is generated which correspond to even harmonic order position and is known as sideband peak. The sideband peaks are present between all odd orders and is marked by even numbers from 18th to 28th order. The energy resolution of the MB e-TOF spectrograph (ΔE) of 77meV is measured at 11eV photoelectron energy (correspond to 21st harmonic order), whereas energy resolution (ΔE) of 0.13eV is estimated at 17eV photoelectron energy (correspond to 25th harmonic order). The ΔE/E is calculated to be ~7×10⁻³ and ~7.6×10⁻³ for the photoelectrons corresponds to 21st and 25th harmonic orders respectively.
Next, the delay between the higher harmonics and the IR laser pulse is varied and oscillation in the side band photoelectron signal is recorded. The sideband oscillation frequency is estimated from the Fourier transform of the sideband photoelectron spectrums (correspond to 18th to 28th even harmonic order), which showed clear oscillation at 2ωL (twice the IR laser frequency), where ωL is the angular frequency of Ti: sapphire laser pulse. The amplitude and relative phase between the odd-harmonic orders are required to estimate the duration of attosecond pulses in pulse train. The relative phase between the sidebands is estimated with respect to sideband peak correspond to 18th harmonic order and is found to be nearly linear for the sidebands correspond to 18th to 28th order. From the estimated relative phase of sideband, the relative phase of odd harmonic orders (from 17th to 28th harmonic) is determined by arbitrarily assuming the phase of 23rd harmonic order to be zero. The amplitude of the odd harmonic order is estimated from the photoelectron count and the photo-ionization cross section at required photon energy. Form the measured amplitude and phase, the duration of attosecond pulse is calculated to be ≈ 290 as (FWHM) and the separation of pulses in pulse train is equal to half the IR laser cycle (≈1.33fs) as shown in Fig 8.
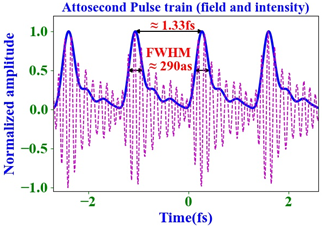
Fig. 8: The reconstructed attosecond pulse trains using RABITT technique.
For more detail please see the publications appearing on the website.
|


